Here's the figure the collaborating grad student sent, showing his LC-MS analysis results of two DNA samples from the first set of GFAJ-1 preparations I sent him.
Each data point is a fraction from one of the CsCl gradients he fractionated the two GFAJ-1 DNA samples on (one for the -As/-P DNA and one for the +As/-P DNA). The -P condition is actually 3 µM added phosphate - this gives growth to approximately the same density as Wolfe-Simon et al's '-P' condition.
The lines with the solid symbols show the amount of DNA in each fraction - these each show a nice DNA peak at around the 800 µl position in the gradient.
The lines with open symbols show the amount of arsenate in each of these fractions - these lines are hard to see because they're sitting right on top of the X-axis (yes, that means that the amounts of arsenate detected are ~ zero 'ion counts'). The real values aren't necessarily zero, but they're below the detection limit for this experiment.
The dashed line shows the amount of arsenate that should have been detected if 4% of the phosphate in the DNA had been replaced by arsenate, as predicted by Wolfe-Simon et al's gel analysis (data in their Table S2).
![]()
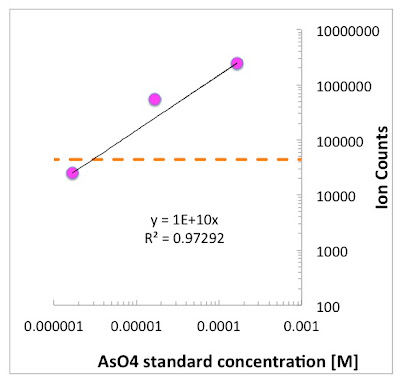
The second graph shows his standard curve for arsenate detection.
![]()
![]()
![]()
![]()
![]()
![]()
![]()
![]()
![]()
![]()
![]()
Each data point is a fraction from one of the CsCl gradients he fractionated the two GFAJ-1 DNA samples on (one for the -As/-P DNA and one for the +As/-P DNA). The -P condition is actually 3 µM added phosphate - this gives growth to approximately the same density as Wolfe-Simon et al's '-P' condition.
The lines with the solid symbols show the amount of DNA in each fraction - these each show a nice DNA peak at around the 800 µl position in the gradient.
The lines with open symbols show the amount of arsenate in each of these fractions - these lines are hard to see because they're sitting right on top of the X-axis (yes, that means that the amounts of arsenate detected are ~ zero 'ion counts'). The real values aren't necessarily zero, but they're below the detection limit for this experiment.
The dashed line shows the amount of arsenate that should have been detected if 4% of the phosphate in the DNA had been replaced by arsenate, as predicted by Wolfe-Simon et al's gel analysis (data in their Table S2).

The second graph shows his standard curve for arsenate detection.